Ming Zeng is a Ph.D. student at Carnegie Mellon University. His research interests include machine learning, deep learning, human behavior modeling, and natural language processing. His work is primarily focused on deep neural networks (DNNs) for human activity recognition. The deep learning models used in his work mainly include convolutional neural networks (CNNs) and Long Short Term Memory (LSTM) with different architectures according to different applications. In addition, instead of treating the deep neural network as a black box, he is trying to interpret the features extracted from DNNs.
Ming will explore the CrowdSignals.io data in the human activity recognition related areas. Deep neural networks can take advantage of the large dataset to train a good model. In addition, because the CrowSignals.io dataset involves a number of sensors, it is worth trying neural networks with a sensor fusion approach.
Thomas Ploetz is a Reader at the Open Lab at Newcastle University. His research is focused on computational behaviour analysis, that is building and deploying (statistical) models that capture behavior and enable quantitative assessments of it. Behavior is thereby captured opportunistically, e.g., through wearable or ubiquitous sensing. He considers himself working as an applied machine learning researcher.
The central theme of Thomas’ research is to develop techniques and systems that actually have an impact on people’s life. Therefore, his research is almost always connected to some practical application (in contrast to purely theoretical work) and he is keen on deploying systems he develops in the “wild”, i.e., in real-world settings. The most prominent domain for this kind of work is health where he is working on computational assessments of behavioral phenotypes of, for example, Parkinson’s, Dementia, or Autism. Within the Digital Interaction group at Newcastle University he is involved in a number of projects that address these research themes from different angles.
Thomas intends to use CrowdSignals.io mainly for unsupervised learning of behavior representations.
Our next guest post is by Vinayak Naik, Associate Professor and Founding Coordinator of the MTech in CSE with specialization in Mobile Computing at IIIT-Delhi, New Delhi, India. He writes about his group’s research on using smartphone sensors to measure metro traffic in New Delhi.
In recent years, mobile sensing has been used in myriad of interesting problems that rely on collection of real-time data from various sources. The field of crowd-sourcing or participatory sensing is extensively being used for data collection to find solutions to day-to-day problems. One such problem of growing importance is analytics for smart cities. As per Wikipedia, a smart city is defined as an urban development vision to integrate multiple information and communication technology (ICT) solutions in a secure fashion to manage a city’s assets and notable research is being conducted in this direction. One of the important assets is transportation. With the growing number of people and shrinking land space, it is important to come up with solutions to reduce pollution caused by the vehicles and ease commuting between any two locations within the city.
Today, cities in developed countries, such as New York, London, etc, have millions of bytes of data being logged on a diurnal basis using sensors installed at highway and metro stations. This data is typically leveraged to carry out an extensive analysis to understand usage of roads and metro across the city’s layout and aid in the process of better and uniform city planning in long term. However, a common challenge faced in developing countries is the paucity of such detailed data due to lack of sensors in the infrastructure. In the absence of these statistics, the most credible solution is to collect data via participatory sensing using low-cost sensors like accelerometer, gyroscope, magnetometer, GPS, and WiFi that come packaged with modern day smartphones. These sensors can be used to collect data on behalf of users, which upon analysis can be leveraged in the same way as data made available through infrastructure-based.
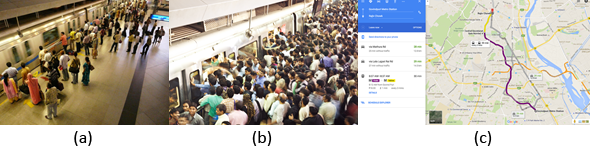
Figure 1: (a) and (b) show the relative rush at a given station which aids us in estimating wait time across metro stations. (c) shows a possible Google Maps Utility where an alternate route or transport mode can be suggested depending on the amount.
In short term, this data can be leveraged to guide commuters about expected rush at the stations. This is important as in some extreme cases wait time at stations could be more than the travel time itself. Aged people, those with disabilities, and children can possibly avoid traveling if there is rush at stations. We show two snapshots of platform at Rajiv Chowk metro station in Delhi, in Figure 1(a) and Figure 1(b). These figures show variation in the amount of rush that can happen in a real life scenario. In the long run information from our solution can also be integrated with route planning tools (e.g., Google Maps, see Figure 1(c)), to give an estimated waiting time at the stations. This will help those who want to minimize or avoid waiting at the stations.
About a decade ago, even cities in developed countries had less infrastructural support to get sensory data. The author was the lead integrator of the Personal Environmental Impact Report (PEIR) project in 2008. The objective of the project was to estimate emission and exposure to pollution for the city of Los Angeles [1] in USA. PEIR used data from smartphones to address the problem of lack of data. Today, the same approach is applicable in developing countries, where reach of smartphones is more than that of infrastructure-based sensors. At IIIT-Delhi, master’s student Megha Vij, co-advised by Prof. Viswanath Gunturi and the author, worked her thesis [2] on the problem to build a model, which can predict the metro station activity in the city of New Delhi, India using accelerometer logs collected from a smartphone app.
Our approach is to detect commuter’s entry into metro station and thereon measure time spent by the commuter till he/she boards the train. Similarly, we measure the time spent from disembarking the train until exiting the metro station. These two time-durations are indicative of the rush at metro stations, i.e., more the rush, more the time spent. We leverage geo-fencing APIs on the smartphones to detect entry into and exit from the metro stations. These APIs efficiently use GPS to detect whether the user has crossed a boundary, in our case perimeter around the metro station. For detecting boarding and disembarking, we use accelerometers on the smartphones to detect whether the commuter is in a train or not. Unlike geo-fencing, the latter is an unsolved problem. We treat this problem as a two class classification, where the goal is to detect whether a person is traveling in a train or is at the metro station. Furthermore, the “in-metro-station” activity is a collection of many micro-activities including walking, climbing stairs, queuing, etc and therefore, needs to be combined into one single category for the classification. We map this problem to machine learning and explore an array of classification algorithms to solve it. We attempt to use discriminating, both probabilistic and non-probabilistic, classification methods to effectively distinguish such patterns into “in-train” and “in-metro-station” classes.
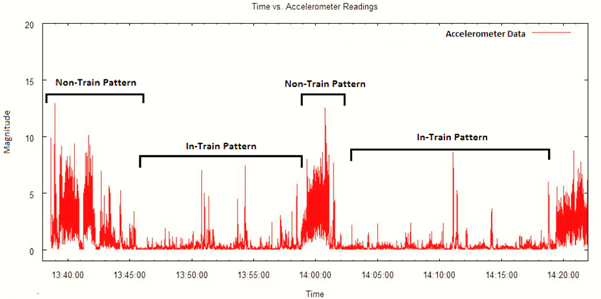
Figure 2: Sample accelerometer data annotated with the two mobility patterns, “in-train” and “in-station”
Figure 2 illustrates “in-train” and “in-metro-station” classes on sample accelerometer data that we collected. One may observe a stark difference in accelerometer values across the two classes. The values for the”in-train” class have less variance, whereas for the “in-metro-station” class, we observe heavy fluctuations (and thus much greater variance). This was expected since a train typically moves at a uniform speed, whereas in a station we would witness several small activities such as walking, waiting, climbing, sprinting, etc.
It is important to note that this problem is not limited to only analytics for smart cities, e.g., our work is applicable for personal health. Smart bands and watches are used these days to detect users’ activities, such as sitting, walking, and running. At IIIT-Delhi, we are working on these problems. A standardized data collection and sharing app for smartphones would leapfrog our research. CrowdSignals.io fills this need aptly.
Takeshi Okadome is a Professor in the Department of Informatics at Kwansei Gakuin University. His group works on environmental media design, using various sensors to design a new media that represents a physical or “mind” state of a physical object in an environment, and using the media, they create various contents, in particular, web contents together with each person’s favorite objects.
They use sensor network, physical computing, and machine learning technologies to attempt to: (1) to establish a method for interpreting sensor data and verbalizing or visualizing them, (2) to interpolate human actions or real-world events that cannot be directly inferred from sensor data by mining the information on the web, (3) to design “environment media” that represent the verbalized or visualized data, and (4) to create web contents using the environment media. The group also works on recognition of daily living activities from sensor data using machine learning techniques.
Prof. Okadome will use the CrowdSignals.io data to construct better recognition methods for daily living activities using CrowdSignals.io Data and also test the methods using them.

 Ming Zeng is a Ph.D. student at Carnegie Mellon University. His research interests include machine learning, deep learning, human behavior modeling, and natural language processing. His work is primarily focused on deep neural networks (DNNs) for human activity recognition. The deep learning models used in his work mainly include convolutional neural networks (CNNs) and Long Short Term Memory (LSTM) with different architectures according to different applications. In addition, instead of treating the deep neural network as a black box, he is trying to interpret the features extracted from DNNs.
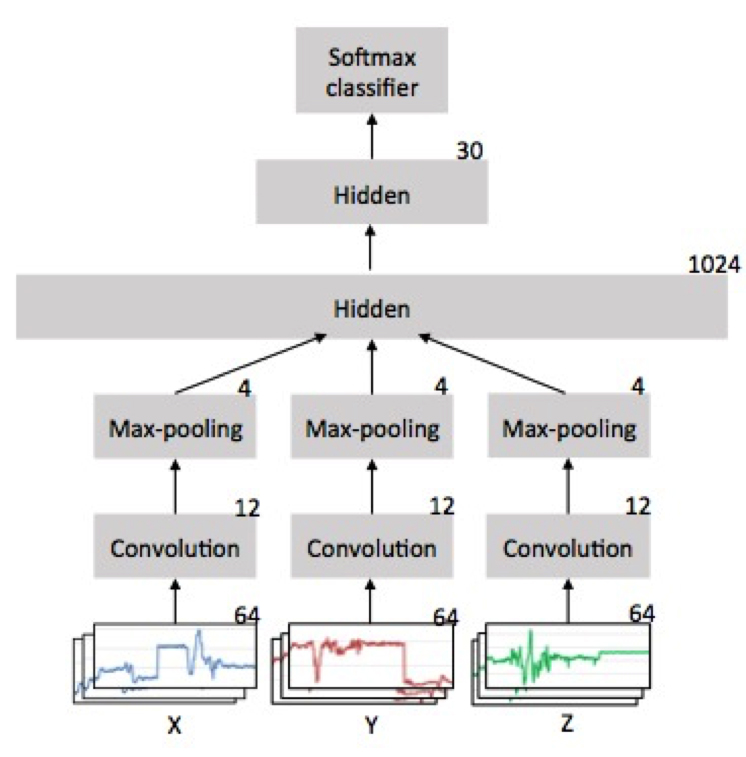
 In recent years, mobile sensing has been used in myriad of interesting problems that rely on collection of real-time data from various sources. The field of crowd-sourcing or participatory sensing is extensively being used for data collection to find solutions to day-to-day problems. One such problem of growing importance is analytics for smart cities. As per Wikipedia, a smart city is defined as an urban development vision to integrate multiple information and communication technology (ICT) solutions in a secure fashion to manage a city’s assets and notable research is being conducted in this direction. One of the important assets is transportation. With the growing number of people and shrinking land space, it is important to come up with solutions to reduce pollution caused by the vehicles and ease commuting between any two locations within the city.