R Venkatesha Prasad is an Assistant Professor at TU Delft where he has been supervising Ph.D. and M.Sc. students and teaching courses. His work at TUDelft has resulted in 180+ publications and he also contributes to the academic community by reviewing and organizing conferences and workshops as well as by leading technical committees and memberships for standards boards. He is a senior member of ACM & IEEE.
Prof. Prasad completed his Ph.D. from IISc Bangalore, India in 2003 where he designed a scalable VoIP conferencing platform. The work involved understanding of network protocols, application design, and human computer interface. Part of the thesis lead to a startup venture, Esqube, where he lead the engineering of real-time applications including bridging anonymous VoIP calls called Click-to-Talk for Ebay.com, and filed both patents and PCT applications with his colleagues. Esqube was selected as top 100 IT innovators in India in 2006 by NASSCOM and top 100 in promising companies in Asia by RedHerring in 2008.
Since joining TUDelft as a PostDoc in 2005, he has worked on the EU FP7 Magnet Project and the Dutch project PNP-2008 on Personal Networks (PNs). He also started working on Cognitive Radio Networks (CRNs) and 60GHz networks for future homes. He is contributing to IEEE standards on CRNs. Now, his work involves the Internet of Things (IoT), Cyber Physical systems (CPS) and energy harvesting networks and he is working on EU funded iCore project on IoTs.
Data is everywhere but they are all fragmented. Venkatesha expects to use CrowdSignals.io data to deliver cohesive new insights. He hopes to use the data from CrowdSignals.io for his research on developing “knowledge” from this data, going one step above “information processing”.
Our next guest post is by Vinayak Naik, Associate Professor and Founding Coordinator of the MTech in CSE with specialization in Mobile Computing at IIIT-Delhi, New Delhi, India. He writes about his group’s research on using smartphone sensors to measure metro traffic in New Delhi.
In recent years, mobile sensing has been used in myriad of interesting problems that rely on collection of real-time data from various sources. The field of crowd-sourcing or participatory sensing is extensively being used for data collection to find solutions to day-to-day problems. One such problem of growing importance is analytics for smart cities. As per Wikipedia, a smart city is defined as an urban development vision to integrate multiple information and communication technology (ICT) solutions in a secure fashion to manage a city’s assets and notable research is being conducted in this direction. One of the important assets is transportation. With the growing number of people and shrinking land space, it is important to come up with solutions to reduce pollution caused by the vehicles and ease commuting between any two locations within the city.
Today, cities in developed countries, such as New York, London, etc, have millions of bytes of data being logged on a diurnal basis using sensors installed at highway and metro stations. This data is typically leveraged to carry out an extensive analysis to understand usage of roads and metro across the city’s layout and aid in the process of better and uniform city planning in long term. However, a common challenge faced in developing countries is the paucity of such detailed data due to lack of sensors in the infrastructure. In the absence of these statistics, the most credible solution is to collect data via participatory sensing using low-cost sensors like accelerometer, gyroscope, magnetometer, GPS, and WiFi that come packaged with modern day smartphones. These sensors can be used to collect data on behalf of users, which upon analysis can be leveraged in the same way as data made available through infrastructure-based.
Figure 1: (a) and (b) show the relative rush at a given station which aids us in estimating wait time across metro stations. (c) shows a possible Google Maps Utility where an alternate route or transport mode can be suggested depending on the amount.
In short term, this data can be leveraged to guide commuters about expected rush at the stations. This is important as in some extreme cases wait time at stations could be more than the travel time itself. Aged people, those with disabilities, and children can possibly avoid traveling if there is rush at stations. We show two snapshots of platform at Rajiv Chowk metro station in Delhi, in Figure 1(a) and Figure 1(b). These figures show variation in the amount of rush that can happen in a real life scenario. In the long run information from our solution can also be integrated with route planning tools (e.g., Google Maps, see Figure 1(c)), to give an estimated waiting time at the stations. This will help those who want to minimize or avoid waiting at the stations.
About a decade ago, even cities in developed countries had less infrastructural support to get sensory data. The author was the lead integrator of the Personal Environmental Impact Report (PEIR) project in 2008. The objective of the project was to estimate emission and exposure to pollution for the city of Los Angeles [1] in USA. PEIR used data from smartphones to address the problem of lack of data. Today, the same approach is applicable in developing countries, where reach of smartphones is more than that of infrastructure-based sensors. At IIIT-Delhi, master’s student Megha Vij, co-advised by Prof. Viswanath Gunturi and the author, worked her thesis [2] on the problem to build a model, which can predict the metro station activity in the city of New Delhi, India using accelerometer logs collected from a smartphone app.
Our approach is to detect commuter’s entry into metro station and thereon measure time spent by the commuter till he/she boards the train. Similarly, we measure the time spent from disembarking the train until exiting the metro station. These two time-durations are indicative of the rush at metro stations, i.e., more the rush, more the time spent. We leverage geo-fencing APIs on the smartphones to detect entry into and exit from the metro stations. These APIs efficiently use GPS to detect whether the user has crossed a boundary, in our case perimeter around the metro station. For detecting boarding and disembarking, we use accelerometers on the smartphones to detect whether the commuter is in a train or not. Unlike geo-fencing, the latter is an unsolved problem. We treat this problem as a two class classification, where the goal is to detect whether a person is traveling in a train or is at the metro station. Furthermore, the “in-metro-station” activity is a collection of many micro-activities including walking, climbing stairs, queuing, etc and therefore, needs to be combined into one single category for the classification. We map this problem to machine learning and explore an array of classification algorithms to solve it. We attempt to use discriminating, both probabilistic and non-probabilistic, classification methods to effectively distinguish such patterns into “in-train” and “in-metro-station” classes.
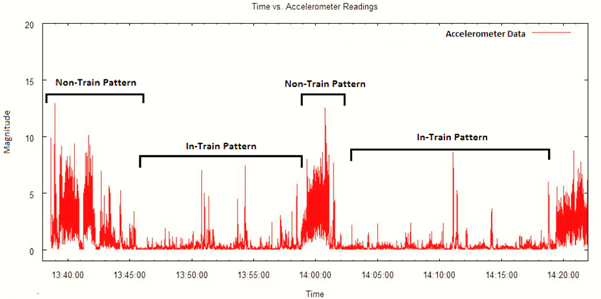
Figure 2: Sample accelerometer data annotated with the two mobility patterns, “in-train” and “in-station”
Figure 2 illustrates “in-train” and “in-metro-station” classes on sample accelerometer data that we collected. One may observe a stark difference in accelerometer values across the two classes. The values for the”in-train” class have less variance, whereas for the “in-metro-station” class, we observe heavy fluctuations (and thus much greater variance). This was expected since a train typically moves at a uniform speed, whereas in a station we would witness several small activities such as walking, waiting, climbing, sprinting, etc.
It is important to note that this problem is not limited to only analytics for smart cities, e.g., our work is applicable for personal health. Smart bands and watches are used these days to detect users’ activities, such as sitting, walking, and running. At IIIT-Delhi, we are working on these problems. A standardized data collection and sharing app for smartphones would leapfrog our research. CrowdSignals.io fills this need aptly.
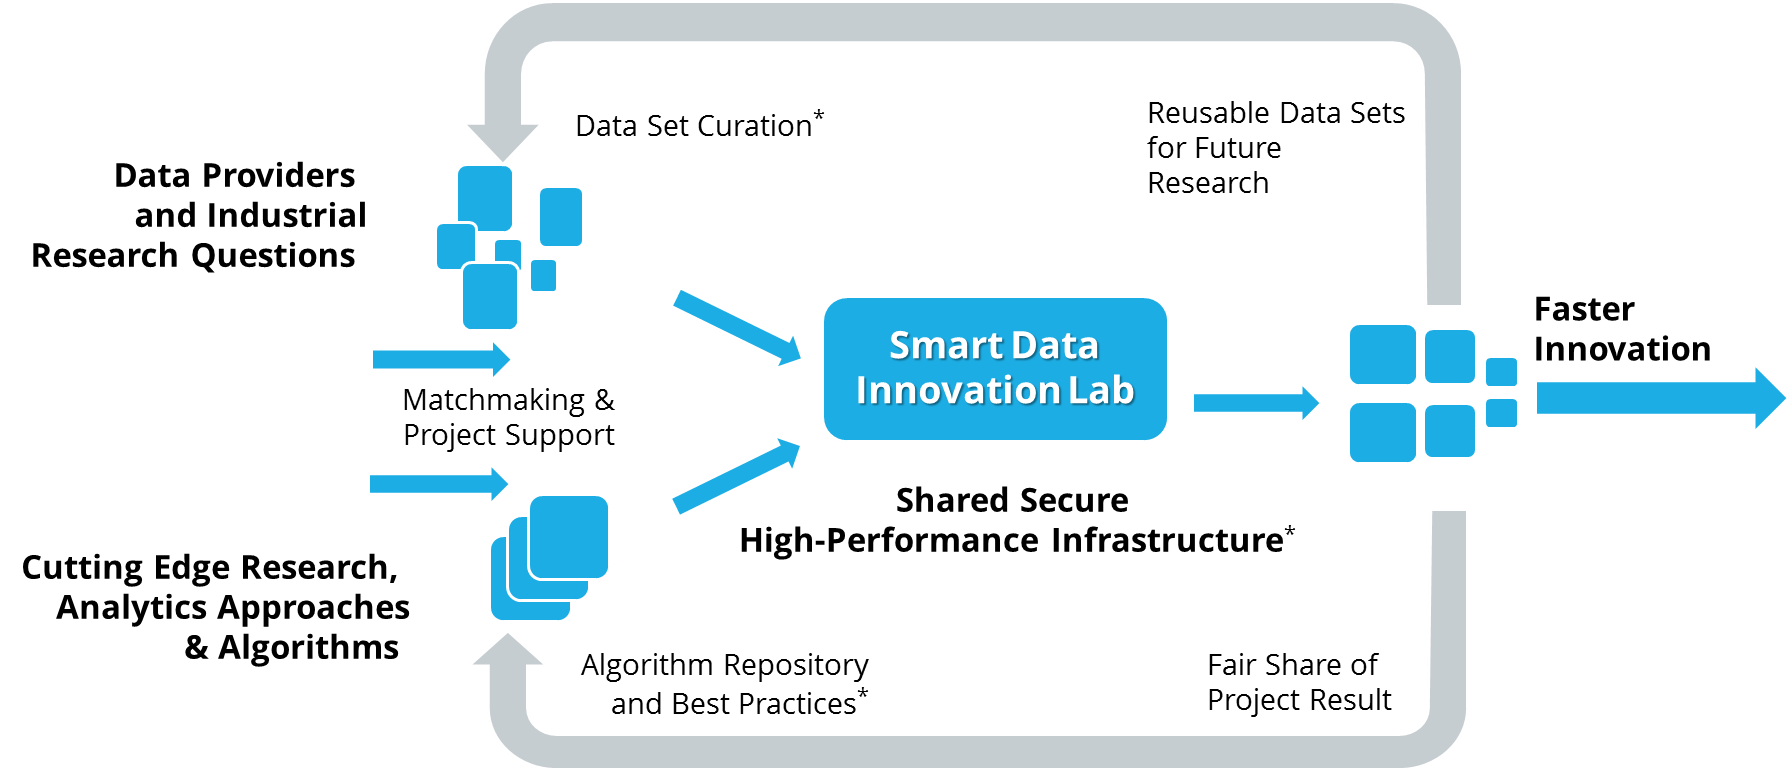
The Smart Data Innovation Lab (SDIL) offers big data researchers a unique access to a large variety of Big Data and In-Memory predictive analytics technologies (e.g. SAP HANA, IBM WATSON, Software AG Terracotta). Industry and science collaborate closely in order to find hidden value in big data and generate smart data. Projects are focused on the strategic research areas of Industrie 4.0, Smart Energy, Smart Cities and Personalized Medicine. In order to close today’s gap between academic research and industry problems through a data driven innovation cycle the SDIL provides extensive support to all collaborative research projects free of charge (applications are accepted via the web site).
SDIL provides access to experts and domain-specific skills within Data Innovation Communities fostering the exchange of project results. They further provide the possibility for open-innovation and bilateral matchmaking between industrial partners and academic institutions. Template agreements and processes ensure fast project initiation at maximum legal security fit to the common technological platform. A standardized process allows anyone to set up a new collaborative project at SDIL within 2 weeks. Furthermore, it actively lists data sources such as CrowdSignals.io and lists relevant code artifacts to augment the unique industrial grade solutions provided within the platform.
SDIL is a community effort from both industry and academia in Germany coordinated by Prof. Michael Beigl’s team at TECO. The Karlsruhe Institute of Technology runs the platform.
One use case for CrowdSignals.io data that will be investigated by KIT TECO in personalized medicine is investigating correlations between interruptibility of a user and their context for field research and surveying. They expect to be able to infer interruptibility rules to implement a smart notification management system. It shall handle notifications with respect to the user’s interruptibility with the objective to improve user experience.
Founded in 2014, SenseGrow is a technology startup committed to providing the best possible Internet of Things (IoT) technology to its customers. SenseGrow creates easy to use IoT software that enables developers to build IoT solutions faster and businesses to get more value from their connected devices.
Build your IoT products and solutions 10x faster with zero upfront cost and no risk. SenseGrow’s secure middleware platform enables you to focus on your business case or product without worrying about the underlying IoT infrastructure. Use SenseGrow APIs to securely connect with Devices, People, Apps or Things and let them worry about the embedded coding involved. Run remote diagnostics, reports and update firmwares on your Things with no hassle. SenseGrow is currently offering a free trial of InstaMsg for real-time IoT connectivity and messaging!
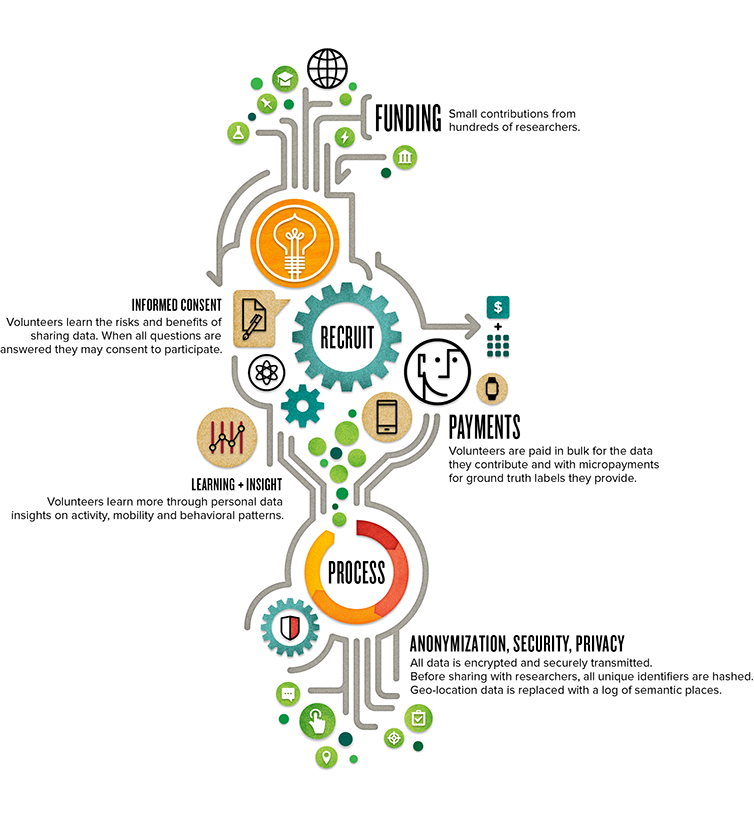
At our current level of funding we’re guaranteeing 100+GB of data from 30 volunteers for 30 days. This includes sensor, social, system, and interaction data in addition to ground truth on contact relationships, places visited, and 2 additional phenomena to be selected by Backers. But we can do better! With your support we can boost the diversity and density of ground truth labels, making the data more useful for an even broader spectrum of researchers and data scientists!
It only costs $2 per academic researcher or $5 per data scientist to contribute
Help us prove the concept and receive Big Data at a tiny fraction of the cost. Support the campaign at any level and share or tweet the news!
Contact us directly with any questions or feedback: organizers@crowdsignals.io
Today we launch Phase 1 of CrowdSignals.io on Indiegogo! We’re collecting 100+ GB (over 20K hours!) of rich sensor, social, system, interaction, and ground truth data from smartphones and smartwatches. We’re confident we can create an excellent dataset: the real experiment is in crowdfunding and community.
We’re asking for your help to generate funds that will pay volunteers and administrative staff. In return, we’ll share the all collected data, sample code, and a direct connection to a community of 1,000s of researchers and developers.
More about CrowdSignals.io:
Donations are just $2 per academic researcher and $5 per data scientist or engineer!
100+ GB of sensor, social, system, and interaction data
Precise ground truth labels
Executed by AlgoSnap, a bootstrapped, Seattle-based start-up
Advised by:
– Andrew Campbell (Dartmouth)
– Deborah Estrin (Cornell)
– Henry Tirri (Aalto U)
– Jason Hong (CMU)

 R Venkatesha Prasad is an Assistant Professor at TU Delft where he has been supervising Ph.D. and M.Sc. students and teaching courses. His work at TUDelft has resulted in 180+ publications and he also contributes to the academic community by reviewing and organizing conferences and workshops as well as by leading technical committees and memberships for standards boards. He is a senior member of ACM & IEEE.
 In recent years, mobile sensing has been used in myriad of interesting problems that rely on collection of real-time data from various sources. The field of crowd-sourcing or participatory sensing is extensively being used for data collection to find solutions to day-to-day problems. One such problem of growing importance is analytics for smart cities. As per Wikipedia, a smart city is defined as an urban development vision to integrate multiple information and communication technology (ICT) solutions in a secure fashion to manage a city’s assets and notable research is being conducted in this direction. One of the important assets is transportation. With the growing number of people and shrinking land space, it is important to come up with solutions to reduce pollution caused by the vehicles and ease commuting between any two locations within the city.
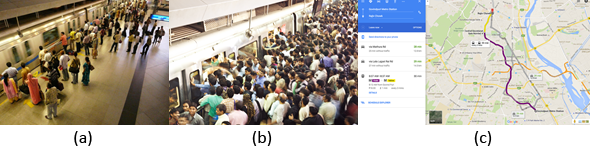
 SDIL provides access to experts and domain-specific skills within
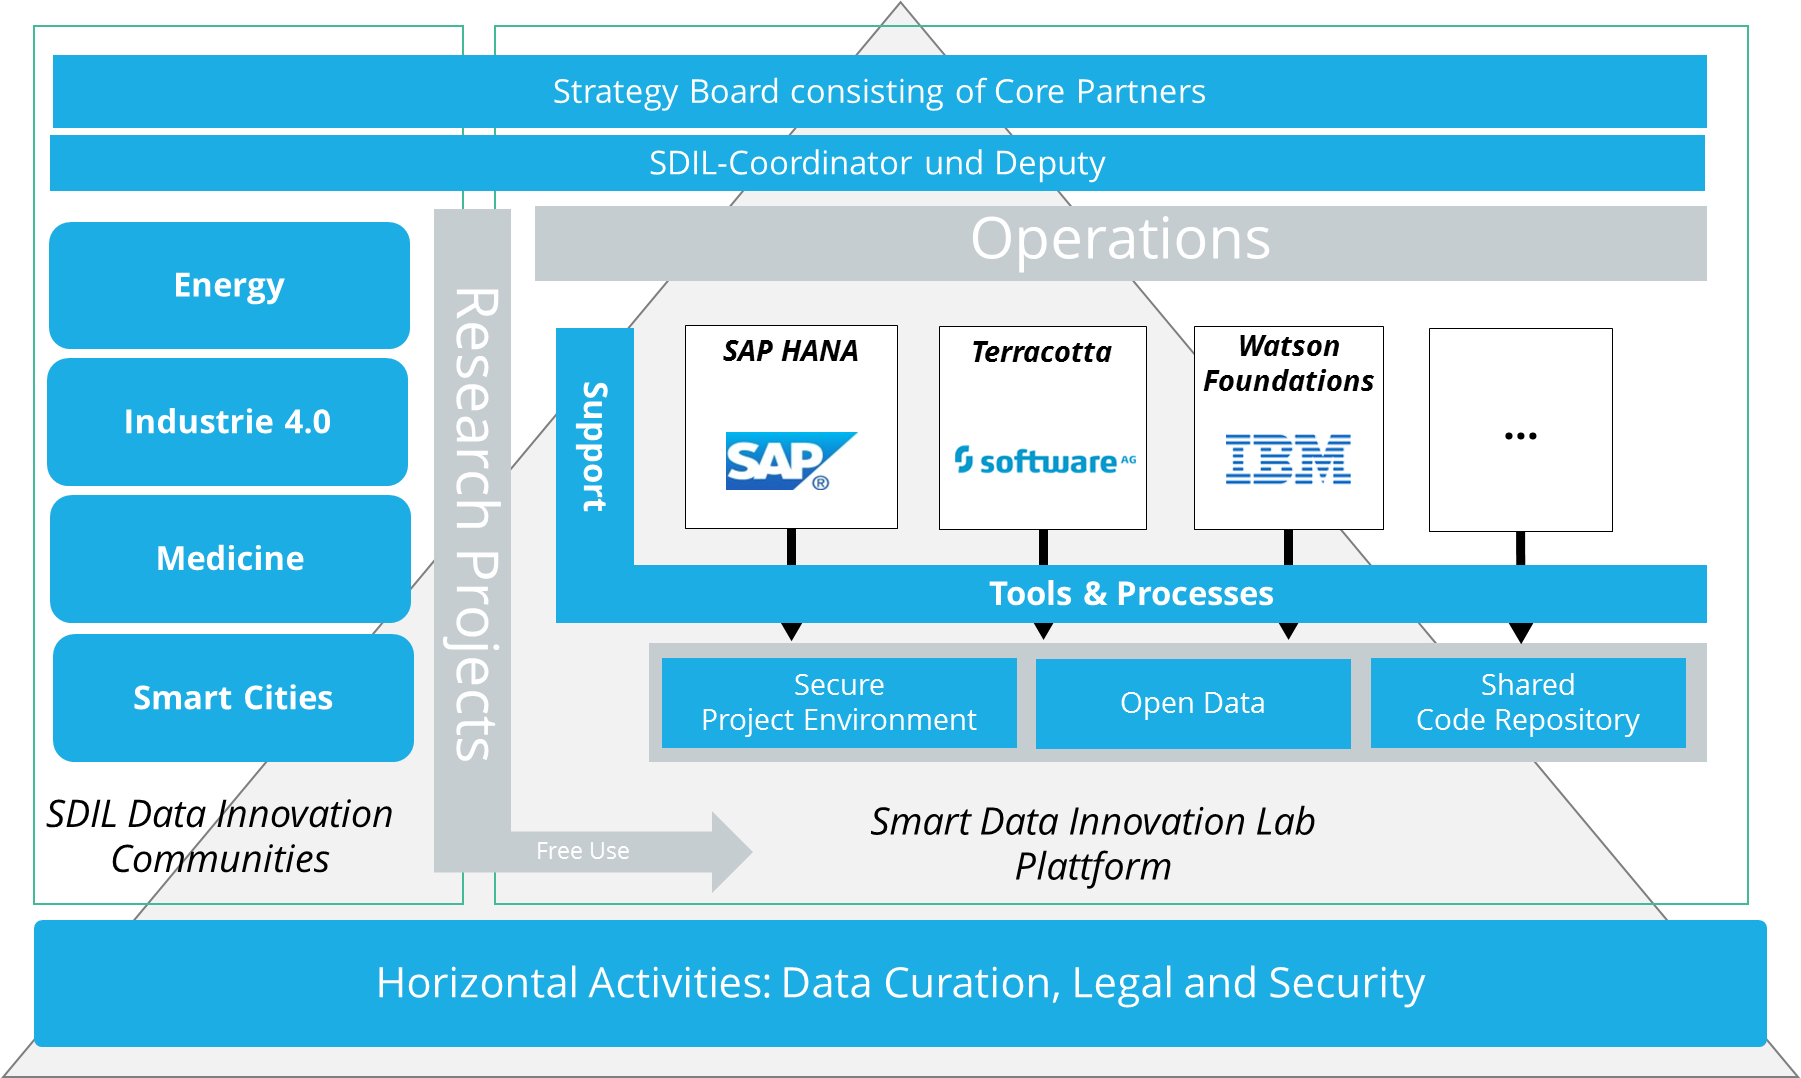
 Build your IoT products and solutions 10x faster with zero upfront cost and no risk. SenseGrow’s secure middleware platform enables you to focus on your business case or product without worrying about the underlying IoT infrastructure. Use SenseGrow APIs to securely connect with Devices, People, Apps or Things and let them worry about the embedded coding involved. Run remote diagnostics, reports and update firmwares on your Things with no hassle. SenseGrow is currently offering a